You read the headlines. You catch the obvious ones.
But how many did you miss?
Commodity markets react to events across the entire supply chain. Refinery outages, shipping disruptions, policy shifts, crop failures, production decisions. These happen across thousands of sources and dozens of languages, around the clock.

2.5M articles / day
Global news traffic
50,000 news / day
About Commodities
30,000 news / day
About crude oil
10,000 news / day
Actually relevant
2,000 news / day
Novel events
Thousands of sources. Dozens of languages. Every wire, every agency, every regional publication. This is the daily reality of commodity news.
Professional workflows run on structured data: prices, inventories, fund positions, trade flows. But roughly 80% of market data is unstructured, and among unstructured sources, news has long been recognized as one of the most price-relevant. Yet it sits outside the analytical stack. Manually categorizing thousands of articles per day is not feasible.
LLMs to the Rescue?
The obvious answer is to throw a large language model at the problem. But commodity markets demand deterministic, reproducible, and verifiable output. Not fluency.
LLMs generate plausible-sounding analysis that never happened. Their training data also contains future outcomes, creating lookahead bias: the model appears accurate in backtests by unknowingly referencing what happened next. In live deployment, this advantage vanishes.
You cannot delegate everything to an LLM and expect deterministic, gapless results. Deduplication, entity linking, and structured extraction require dedicated pipelines.
Anyone who has used ChatGPT knows: rephrase the same question and you get a different answer. LLM outputs depend heavily on how you phrase the prompt, and the same prompt can produce different results each time. At scale, this makes systematic classification impossible to verify or reproduce.
Processing millions of articles daily through commercial LLM APIs is prohibitively expensive. And for proprietary trading strategies, routing sensitive data through third-party cloud infrastructure introduces unacceptable dependency and confidentiality risk.
A more powerful model does not solve an input problem. Without proper classification, better LLMs just process unstructured noise faster.
What About Specialized Models?
Off-the-shelf financial models? FinBERT, the finance industry's standard sentiment model, was trained on stock market language. Applied to crude oil on a basic 3-class sentiment task (positive, neutral, negative), it scores an F1 of 0.23. Barely better than random. It cannot distinguish a pipeline explosion from a quarterly earnings call. (Kaplan et al., ICEIS 2023)
Fine-tune your own? Requires custom training data that doesn't exist off-the-shelf, a classification taxonomy built from domain expertise, and years of research iteration. This is the hard part.
Five years of peer-reviewed research. Three publications. Two national science grants. Purpose-built language models, trained on expert-curated commodity taxonomy, that classify news through the mechanics of supply and demand. Not a prompt chain. A system.
Commodity News Classification Grounded in Supply and Demand
Purpose-built language models that process the entire global commodity news wire at scale. Every classification grounded in the interplay of supply and demand. Peer-reviewed. Government-backed. 30 years of commodity events, classified and quantified.
How It Works
From raw headline to actionable signal in three steps.
CLASSIFICATION
Our model maps every headline to its fundamental driver: production cut, refinery fire, OPEC decision, sanction, storm, demand shift. Automatically. In real time.
QUANTIFICATION
Each classified event receives an economic score. A pipeline disruption is not "negative news." It is reduced supply, tighter market, price support. The score reflects the mechanism, not the tone.
USE CASE
30 years of classified events mean every new headline has historical precedent. See how the market reacted the last 47 times this event type occurred.
See it in action

Explosion at Philadelphia Energy Solutions refinery shuts 335kb/d capacity, largest East Coast outage
Cumulative Economic S&D Score
What You Get
Not a data feed. Structured commodity intelligence across 11 dimensions. Every classified event backtested against 30 years of market history.
News
Original headline and full article
Source
Origin publication, language, and wire service
Event Classification
What happened (refinery fire, OPEC decision, sanction, storm)
GPE / Location
Where it happened (country, city, region, facility)
Numerical Clues
Magnitude sensitivity (335kb/d, 12%, largest since 2019)
Commodity Affected
Which commodity, including indirect macro effects
Type
Factual observation, expert projection, or rumor
Novelty
Deduplication window (day, week, month, year, all-time)
Thematic Group
Cluster ID linking related events across time
Actionability
Direct impact, spillover effect, or not actionable
Impact Ranking
Weighted by country production and consumption share
Economic Score
Expected price impact via supply and demand mechanism
Scenario-Based Backtesting
With 30 years of classified events, every new headline has historical precedent. Isolate the signal from the noise:
- Filter by isolation (no spillover effects from concurrent events)
- Segment by market regime and liquidity period
- Exclude routine calendar events (OPEC, CFTC, WASDE, EIA reports)
Backtest: How did the market react to this event type?
WTI Crude Oil
Commodity Data, Unified
Our classification sits on a unified commodity database purpose-built for fast hypothesis testing. Sourced from EIA, USDA, CONAB, Baker Hughes, CFTC, and minute-level futures data.
Fund Positioning
890K+
RECORDS
6 report types. Who is long, who is short, and how crowded is the trade.
Weekly since 2005
Inventories & Production
20M+
RECORDS
Petroleum, natural gas, coal, electricity, nuclear. The physical reality behind the headlines.
Since 1982
Supply & Demand Balances
1.7M
RECORDS
69 commodities. 101 regions. The official balance sheets that move agricultural markets.
Monthly since 1995
Crop Health
48
US STATES TRACKED
Weekly condition ratings. 40 crops across 48 US states. The leading indicator for production estimates.
Since 1999
Trade Flows
4.3M
RECORDS
Export sale records across 193 countries. Who is buying what, and how much.
Weekly since 2000
Drilling Activity
113
COUNTRIES
Rig counts across 113 countries and 15 US basins. The leading indicator for production.
Since 2013
Brazilian Agriculture
27
BRAZILIAN STATES
Planted area, production, yield for coffee, grains, sugarcane. 27 Brazilian states.
Price Action
36M+
RECORDS
9 instruments at 1-minute resolution. WTI, Brent, NG, gasoline, coffee, copper, corn, soybeans, wheat.
Since 2008
How You Access It
One classification engine. Dashboard for exploration, API for integration into models and workflows.
Web Dashboard
- Natural language queries across all data sources
- Interactive charts with classified event overlays
- 72-hour detail view with minute-level price action
- Heatmap exploration across 1,000+ event categories
API Access
- SQL and REST endpoints with real-time event feed
- MCP-compatible for AI agent workflows
- Structured output across all 11 classification dimensions
- Historical archive and bulk export (CSV, Parquet, JSON)
REST API Example
GET /api/v1/events
  ?commodity=WTI
  &event_type=Industrial+Event
  &from=2020-01-01
  &include=score,gpe,novelty

// Returns structured events with
// all 11 classification dimensionsResearch
Publications, validation results, and the grants that funded five years of development.
Our language models are particularly strong for commodities with a utilitarian nature: resources extracted and consumed (crude oil, coal, copper, coffee, grains). These markets are fundamentals-driven, where supply and demand reasoning excels. They are less effective for commodities that serve as stores of value (precious metals), where speculative behavior dominates price action. While both follow supply and demand dynamics, the underlying logic differs. We focus our resources on tracking critical resources that serve utility.
100M+
Licensed News (LSEG Reuters)
30
Years of History
1,000+
Commodity-Specific Event Categories
6
Commodities
Crude Oil, Coal, Copper, Coffee, Soybeans, Wheat. More in development.
CrudeBERT vs FinBERT
0.97
CrudeBERT F1 (Macro)
0.23
FinBERT F1 (Macro)
FinBERT Economic Principles of S&D
Predicted label
CrudeBERT Economic Principles of S&D
Predicted label
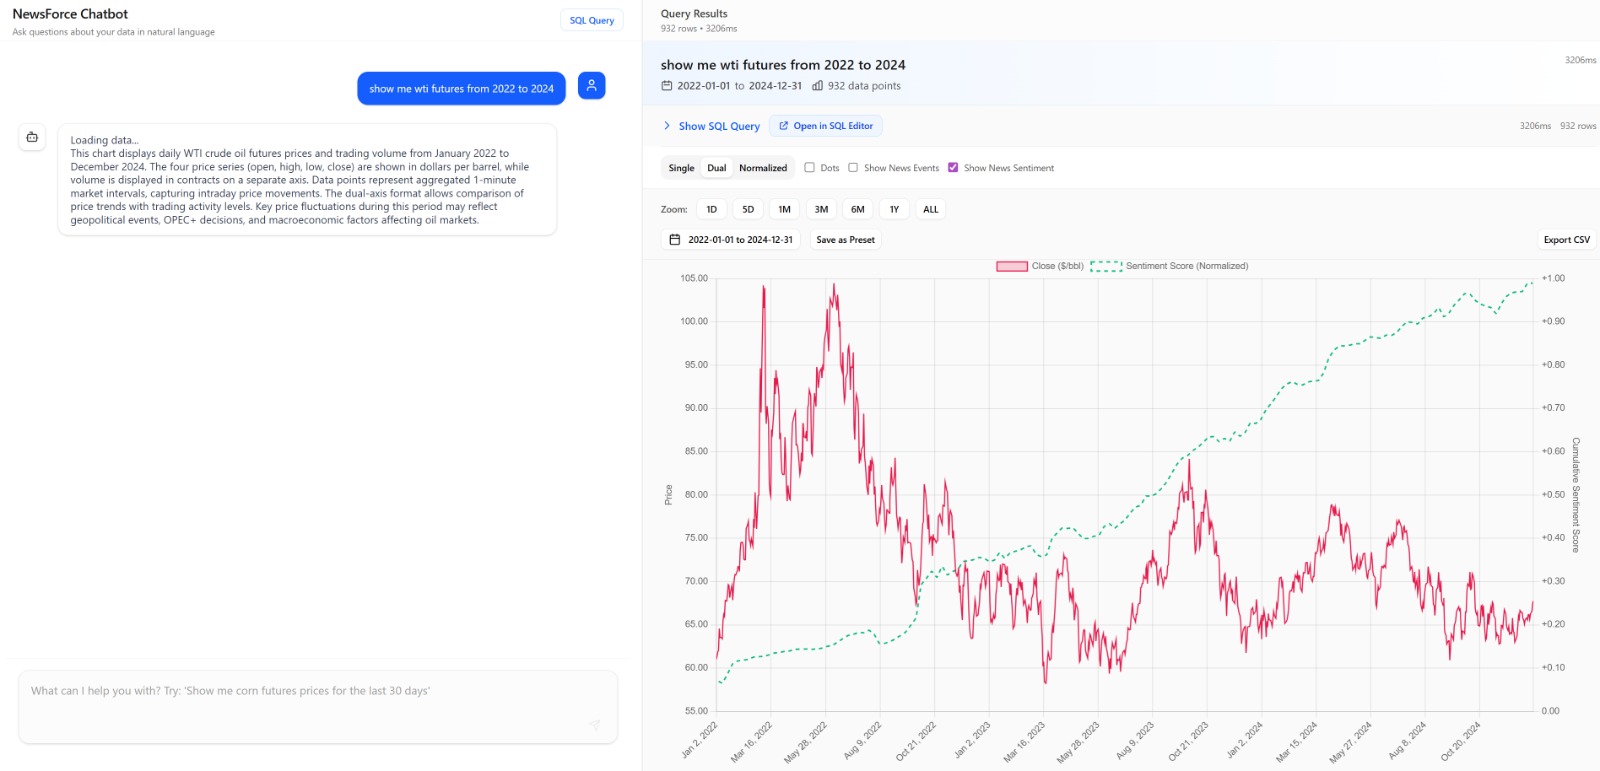
30 Years of Validated Signal
Cumulative news scores reflect WTI futures prices across bull runs, crashes, and sideways regimes.
Peer-Reviewed Publications
Award-Winning Conference Paper
CrudeBERT: Applying Economic Theory towards Fine-Tuning Transformer-Based Sentiment Analysis Models to the Crude Oil Market
Introduced the first language model purpose-built for crude oil markets. Encodes supply and demand dynamics directly into the model architecture, exposing the limitations of general-purpose sentiment tools like FinBERT for commodity analysis.
ICEIS 2023 (25th Int. Conf. on Enterprise Information Systems) · H. Kaplan, R.-P. Mundani, H. Rolke, A. Weichselbraun
High-Impact Journal Publication
Integrating Economic Theory, Domain Knowledge and Social Knowledge into Hybrid Sentiment Models for Predicting Crude Oil Markets
Extended CrudeBERT with additional economic knowledge layers: consumption and export rankings, numerical magnitude sensitivity, and common-sense supply chain reasoning. The resulting CrudeBERT Plus model further closes the gap between raw headline text and tradeable insight.
Cognitive Computing, 2023 · H. Kaplan, A. Weichselbraun, A. M. P. Brasoveanu
If gated behind paywall, contact us for a digital copy.
Springer Book Article
Outperformance of Flagship LLMs by Domain-Specific Models
Demonstrates that specialized models like CrudeBERT consistently outperform general-purpose LLMs that are 1,000x larger and 1,000x slower on commodity event classification tasks.
Springer, 2024 · H. Kaplan, R.-P. Mundani, H. Rolke, A. Weichselbraun, M. Tschudy
If gated behind paywall, contact us for a digital copy.
One Query. Full Context.
News classification, directional score, fund positioning, inventory levels, and minute-level price action. Joined across sources, indexed by event type and date.
No switching between terminals. No manual cross-referencing. The classified event is the foreign key that connects information and action.
Request AccessOne query. Full context.
SELECT
  e.date,
  e.headline,
  e.event_type,
  e.sd_score,
  f.net_long_pct,
  i.crude_stocks_chg,
  p.close_1min
FROM newsquant.events e
JOIN cftc.positioning f
  ON e.date = f.report_date
JOIN eia.weekly_petroleum i
  ON e.date = i.report_date
JOIN futures.wti_1min p
  ON e.timestamp = p.timestamp
WHERE e.commodity = 'WTI'
  AND e.event_type = 'OPEC Decision'
ORDER BY e.date DESC;
The Team
A rare blend of AI engineers with award-winning research and seasoned commodity experts.
Institutional Partners
FHGR Swiss Institute for Information Science
Host institute where our language models are developed. Currently incubated.
ZHAW Institute for Wealth & Asset Management
Evaluating our performance based on industry standards and best practices.
ZHAW Institute for Mechatronic Systems
Providing compute infrastructure. CHF 2.5M on Nvidia DGX.
Backed By


Request Early Access
Get early access to the only commodity intelligence layer where news classification is the product.